One of my primary services is web-hosting and deployment of GoldSim models, which allows sophisticated simulation tools to be delivered to a broader audience through high-performance, browser-based interfaces. This approach is effective for presenting probabilistic models to stakeholders who require a simplified input configuration to explore complex datasets without the overhead of local software installations or deep simulation expertise.
The tool described below is designed to empower users to build their own custom snowmelt-driven watershed runoff models. It is specifically tailored for studying hydrology in snowpack-dominated regions located near GHCN climate stations. Once registered on my website, users gain the ability to create, configure, and manage multiple unique project sites directly from the web interface. By streamlining the entire input process, this platform demonstrates how sophisticated GoldSim simulations (complete with probabilistic climate drivers) can be made accessible to planners, decision-makers, and non-technical stakeholders alike.
Try the Tool: You can access the GoldSim Snowmelt Runoff Dashboard here. (Note: Account registration and log in are required).
Implementation in GoldSim
The tool uses a GoldSim Player model running on a dedicated AWS EC2 Server machine. See the references at the end of this article for references to each of the components built in this GoldSim model.
The engine behind this tool is a robust GoldSim model that integrates several well-established meteorological and hydrological algorithms:
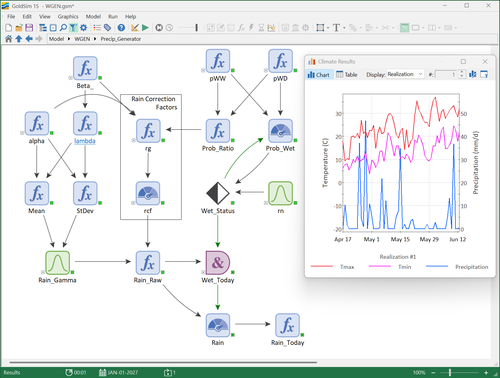
1. WGEN: Stochastic Weather Generation
To account for climatic variability beyond simple historical averages, the model employs a version of the WGEN (Weather Generator) algorithm to synthesize daily precipitation and temperature data. The implementation utilizes a first-order Markov chain to determine wet/dry day sequences and a gamma distribution to calculate precipitation magnitudes for each wet time step. This ensures that the simulation captures the stochastic nature of real-world weather while remaining statistically consistent with monthly historical parameters.
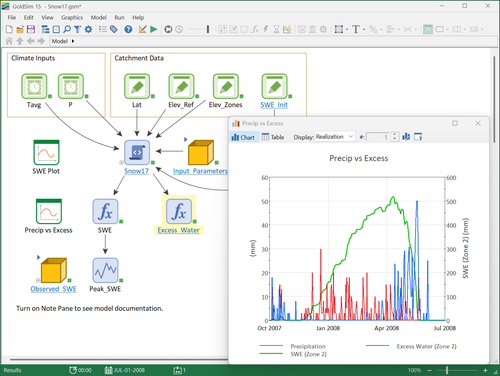
2. SNOW-17: Snow Accumulation and Ablation
Snowpack dynamics are simulated using the SNOW-17 conceptual model. The watershed is discretized into three elevation zones (Low, Mid, and High) to account for temperature and precipitation gradients typical of mountainous terrain. Within these zones, the model computes:
- Phase Identification: Determining rain vs. snow based on temperature thresholds.
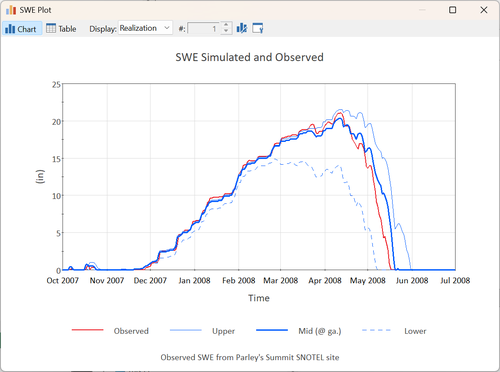
- Snow Water Equivalent (SWE): Tracking the mass of the snowpack through melt factor and energy exchange logic.
- Internal Dynamics: Accounting for heat deficits and the liquid water retention capacity of the snowpack.
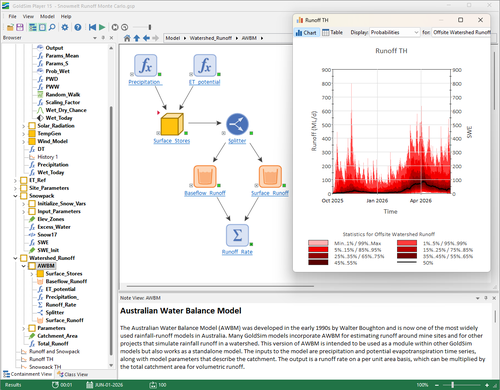
3. AWBM: Watershed Runoff
The liquid water output (rain + snowmelt) is then processed through an Australian Water Balance Model (AWBM). This part of the simulation tracks soil moisture storage across partial areas and routes excess water into surface runoff and baseflow, providing a realistic volumetric discharge for the catchment.
The Web Interface
While the simulation happens in GoldSim, the watershed delineation, data gathering, time series analysis, and model parameter generation all happens in your browser. You can build your own models using this tool in a web-based dashboard at Lillywhite Water to make it accessible to decision-makers without local software requirements. Note: Account registration and log in are required.
The dashboard uses 3 navigation tabs to help you walk through the process of creating a snowmelt-driven watershed runoff model.
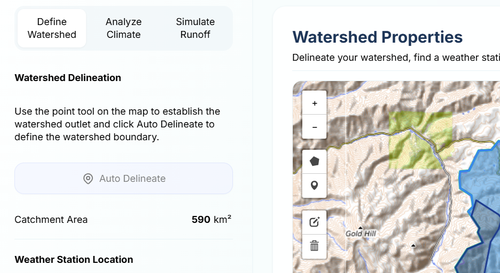
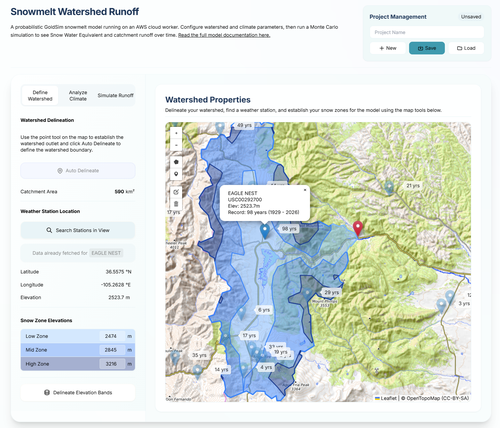
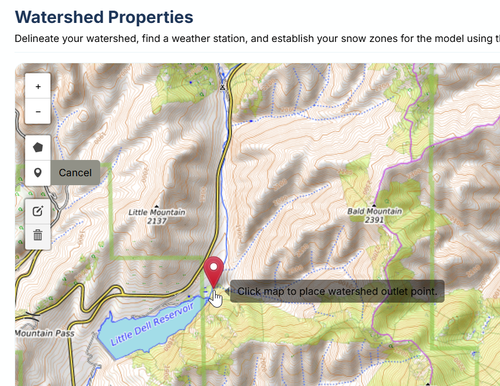
1. Define the Watershed and Select Climate Data Source
Use the map to zoom and pan to the location of the watershed you want to model. Then use the watershed outlet point tool to mark the location of the watershed outlet for your project.
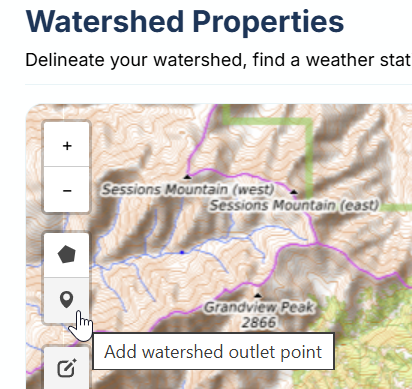
Click on the map to define the location of the watershed outlet.
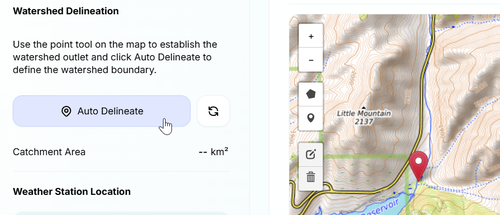
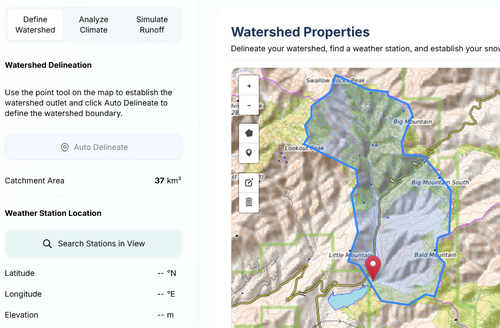
Click on the "Auto-Delineate" button to generate the boundaries of the watershed.
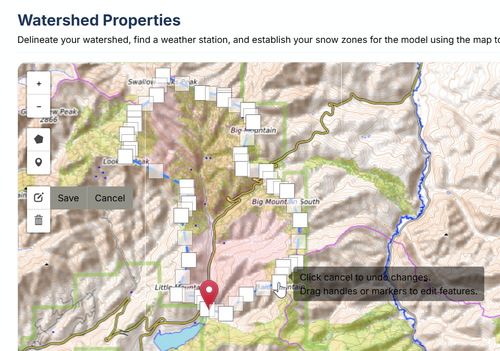
Review the resulting watershed and click on the edit layer tool to fine tune the boundary.
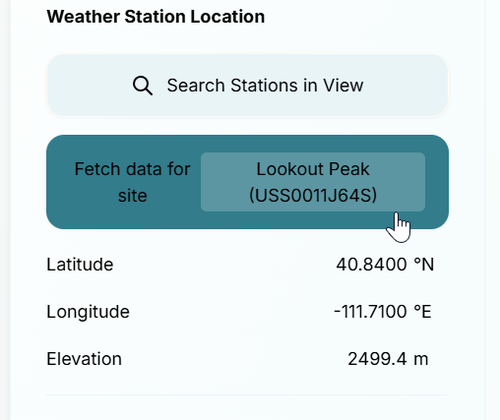
After you delineate the watershed, click the "Search Stations in View" button to find a GHCN weather gauge nearby that we can analyze and select for preparing input parameters for the WGEN stochastic weather generator.
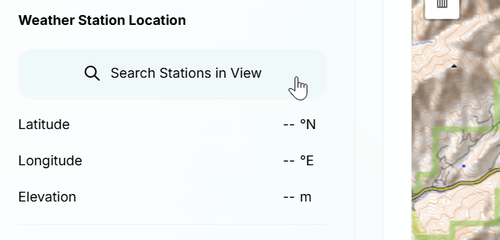
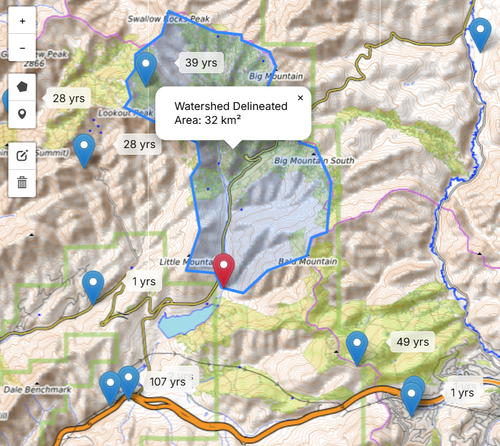
All GHCN weather stations within the map extents will appear along with the number of years they have on record, to help you select one that is suitable for the study. Note that it is recommended that you find at least 30 years of data for the WGEN model.
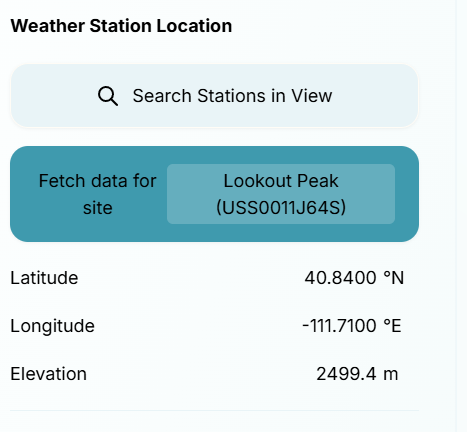
After you choose a weather station, the latitude, longitude, and elevation of that station will appear in the side panel.
Click on the "Delineate Elevation Bands" to define the elevations of the 3 snow zones for the watershed, that are used in the Snow-17 model for adjusting climate relative to the weather station we selected earlier.
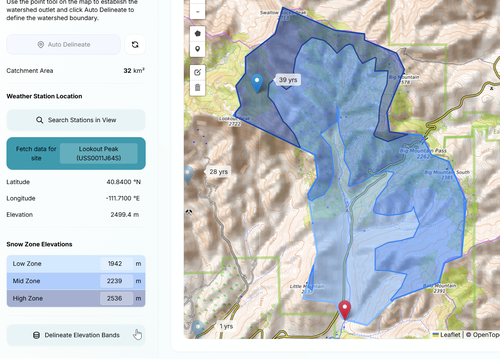
Once all of this information has been collected, we are ready to move forward with the next step: Analyzing the climate data for this site. To to this, Click on the Fetch Data for Site button.
This will take you automatically to the next tab.
2. Analyze the Climate Data
When you click on the Fetch Data for Site button, you will be taken to the next tab, allowing you to visualize some statistics of the GHCN data for the site you selected.
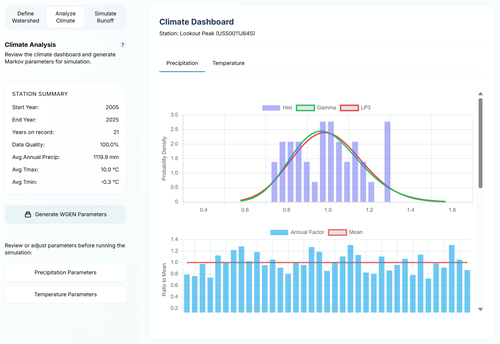
You can review charts for both precipitation and temperature data. If you are okay with the data, click on the Generate WGEN Parameters button. This is the data needed to run the WGEN portion of the GoldSim model, which is the stochastic weather simulator.
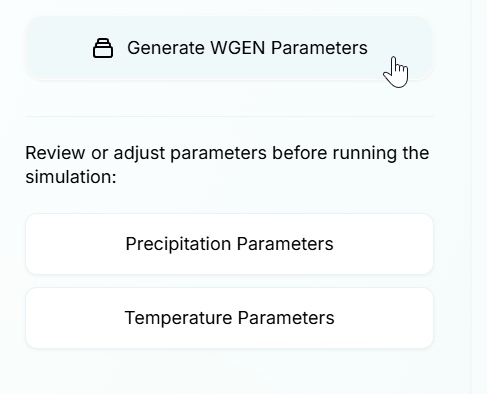
You can also review the parameters before running the model. This is the data that will be passed to the GoldSim model, which is running on a dedicated AWS EC2 Windows server. This data, along with the other attributes of the watershed that we previously established are also passed to the model.
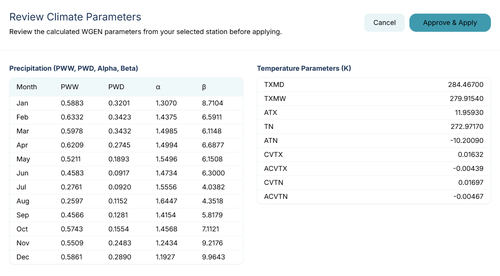
Click approve and apply to save the data to be sent to the model running on the cloud server.
3. Simulate Probabilistic Snowmelt Runoff
Finally, click on the Simulate Runoff tab to prepare for running the GoldSim model.
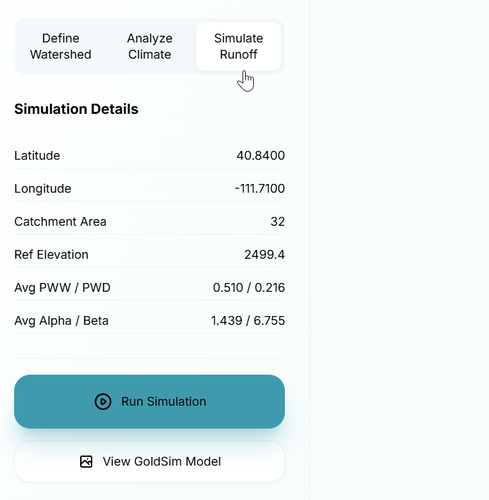
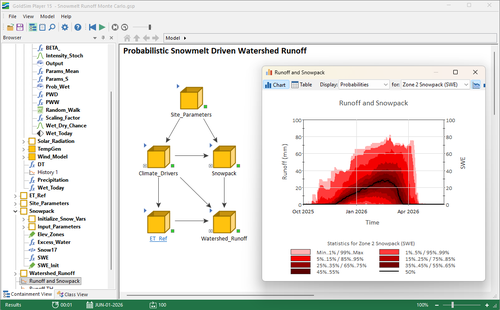
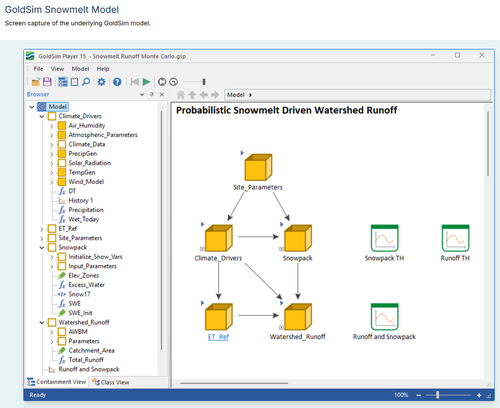
You can click the View GoldSim Model button to view a screen capture of the GoldSim model and get an idea of the major components that are being modelled.
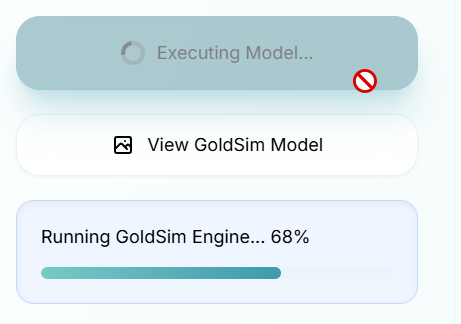
Click the Run Simulation button and wait for the Monte Carlo simulation to complete on the server and then send results back to the website.
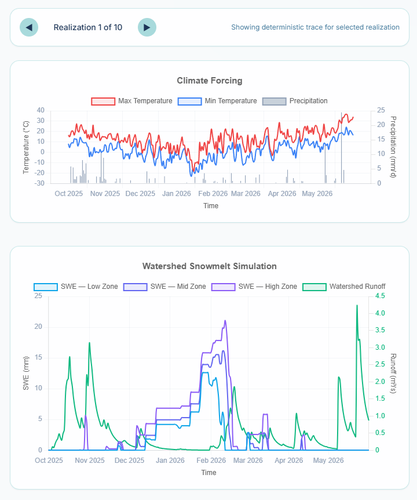
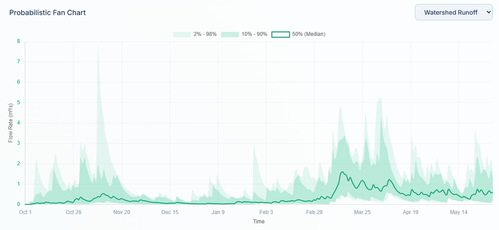
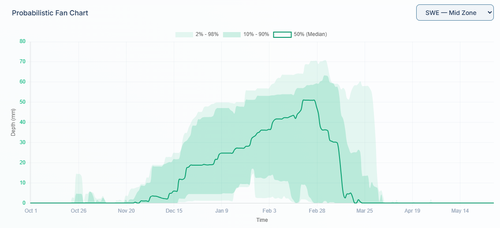
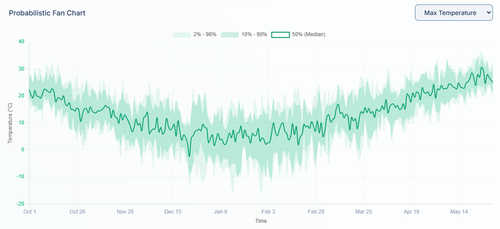
Once the simulation finishes, the results are instantly visualized. The charts below display the daily history of generated precipitation and temperature, alongside the resulting Snow Water Equivalent (SWE) depths for each elevation zone and the total catchment runoff.
3. Visualizing Uncertainty (Outputs)
Rather than presenting the user with an overwhelming raw data dump, the dashboard renders interactive Probabilistic Fan Charts. Users can toggle between viewing the resulting:
- Watershed Flow Rate
- Snow Water Equivalent (SWE) depth across elevation zones
- Generated Weather Patterns
The charts dynamically plot the 2nd, 10th, 50th (median), 90th, and 98th percentile bands. This allows the user to immediately visualize not just a single deterministic outcome, but the entire range of probabilities and bounds of uncertainty—which is the true power of Monte Carlo simulation for water resources planning.
This tool is more than just a calculator; it is a proof of concept for the future of water resources consulting. By leveraging cloud-based simulation, we can provide clients with:
- Immediate Feedback: No waiting for a consultant to re-run a model and send a PDF report.
- Increased Transparency: Stakeholders can "play" with the inputs themselves, building trust in the model outputs.
- Low Friction: Full Monte Carlo capabilities delivered via a URL, accessible on any device.
If you are interested in how this type of web-enabled simulation can support your next watershed study or decision-making process, feel free to explore the tool or reach out directly.
References
Find the GoldSim implementation of WGEN here.
Find the GoldSim implementation of Snow-17 snow accumulation and melt model here
Find the GoldSim implementation of the Australian Water Balance Model - AWBM here.