Climate Scenarios Library
The Climate Scenarios Library is a powerful scenario management tool that allows you to configure alternative operating conditions and meteorological profiles for your hydraulic and agricultural models. Instead of running a single baseline model, you can create parallel scenarios to test how your system performs under historical droughts, future climate change, or specific localized property overrides.
Accessing the Scenarios Library
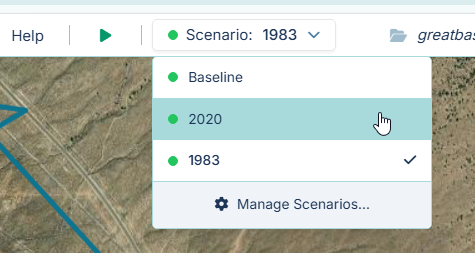
You can open the Scenario Manager modal using one of two methods: 1. Navigate to the top menu bar, click Library, and select Climate Scenarios. 2. Click the Scenario dropdown in the main simulation toolbar and select Manage Scenarios... at the bottom of the list.
The Local Historical Climate Explorer
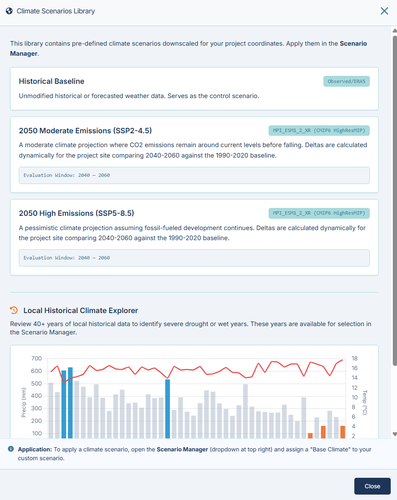
At the top of the modal, you will find the Local Historical Climate Explorer. Because the IAMDD platform fetches climate data specific to the geospatial coordinates of your project, this tool provides immediate context on your site's historical extremes.
When you expand this section, the platform queries over 40 years of local ERA5 Reanalysis data. It then plots a chart displaying the annual precipitation totals and average maximum temperatures for your specific location.
Below the chart, the system automatically analyzes the dataset and explicitly lists the Driest Years and Wettest Years on record for your site. You can use these specific years when selecting a Base Climate Model for your stress-test scenarios.
Creating and Managing Scenarios
By default, your project runs on the "Baseline" scenario. To test alternative conditions, you must define custom scenarios.
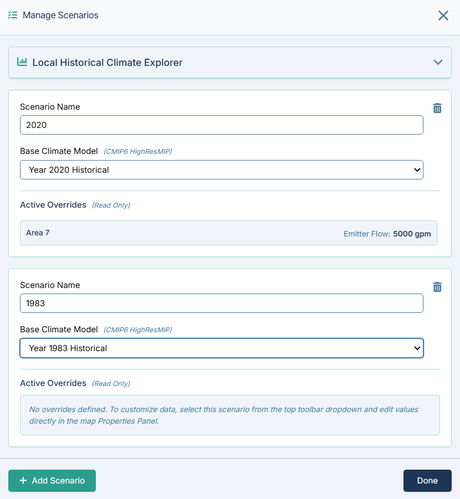
- Add Scenario: Click the Add Scenario button at the bottom of the modal to create a new scenario block. (Note: Standard tier users are limited to 3 active custom scenarios per project).
- Delete Scenario: Click the trash can icon in the top right corner of a scenario block to remove it.
- Done: Click Done to save your scenario configurations to the project state and close the modal.
Configuring a Scenario
For each custom scenario, you can configure the following properties:
1. Scenario Name Assign a descriptive name to your scenario (e.g., "1983 Wet Year Stress" or "2050 High Emissions"). This name will appear in the main toolbar dropdown and on the legends of your comparative charts.
2. Base Climate Model This dropdown determines the underlying meteorological data that will drive the simulation's soil-water balance and evaporative demand models for this specific scenario. * Historical Baseline: Uses the default current-year weather forecast and recent observed data. * Climate Projections (SSP2-4.5 / SSP5-8.5): Uses CMIP6 HighResMIP models to apply dynamically calculated temperature and precipitation deltas (e.g., +2°C, 0.85x precipitation) to your baseline weather, simulating 2050 conditions. * Historical Extremes (Year XXXX Historical): Injects the exact, unscaled daily and hourly weather data from the selected historical year (derived from the ERA5 dataset) into your simulation timeline.
3. Active Overrides (Read-Only) In addition to swapping the climate model, scenarios can also store physical property overrides (e.g., changing a pump's flow rate or a municipal zone's base demand specifically for a drought scenario).
This section lists any component properties that have been overridden for this scenario. Note: You cannot edit these values directly within this modal. To create or edit a physical override: 1. Close the modal. 2. Select the target scenario from the Scenario Dropdown in the main simulation toolbar. 3. Select the physical element on the map. 4. Edit the value in the right-hand Properties Panel (the field will highlight to indicate it is an active override for the current scenario).
Next Steps: Running Your Scenarios
Once you have configured your scenarios in the Library, you must run them to generate results.
- Select your custom scenario from the Scenario dropdown in the main toolbar.
- Click Run Simulation.
- Repeat this process for the Baseline and any other custom scenarios.
- Once multiple simulations have completed, click the Scenario Comparison Chart button in the Results Toolbar to visualize the differing impacts on your network flows, tank levels, and agricultural stress.